MFA Project, Research, UX design, 2013
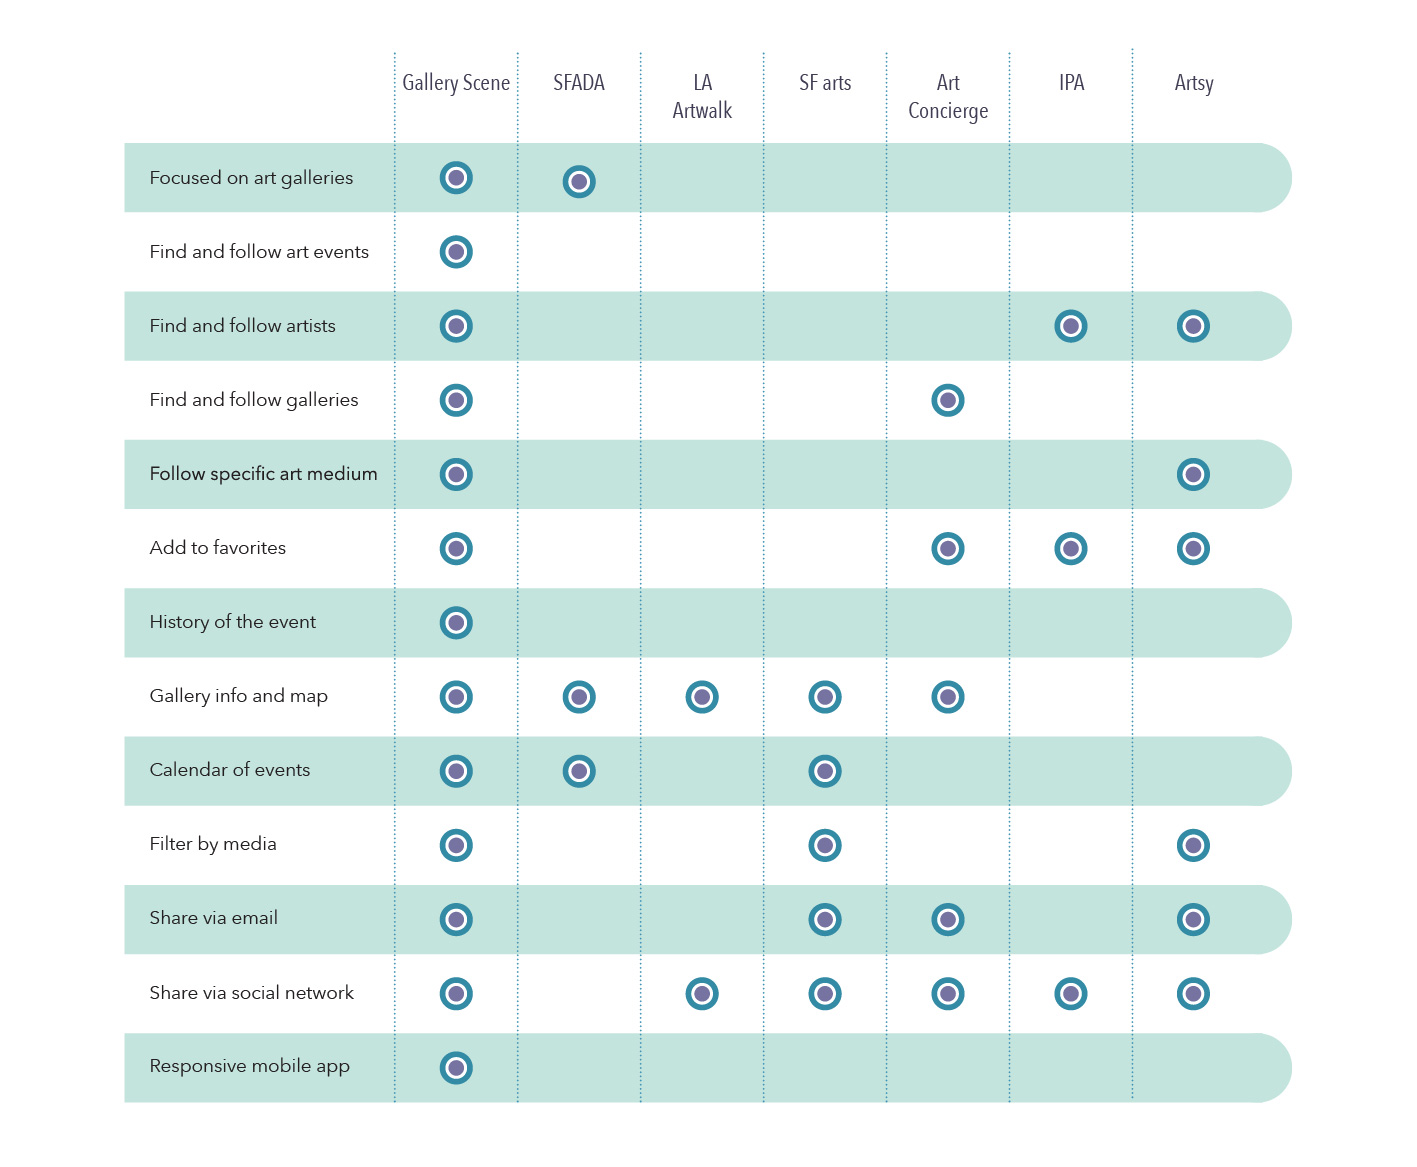
Competitive Analysis Diagram
Thorough market research had been done to initiate the concept of Gallery Scene. This diagram illustrates features and functions of Gallery Scene in comparison with major solutions available in the market. This analysis shows the need for Gallery Scene app that focuses more on art galleries and enables users to stay in touch with galleries and artists of their interest.
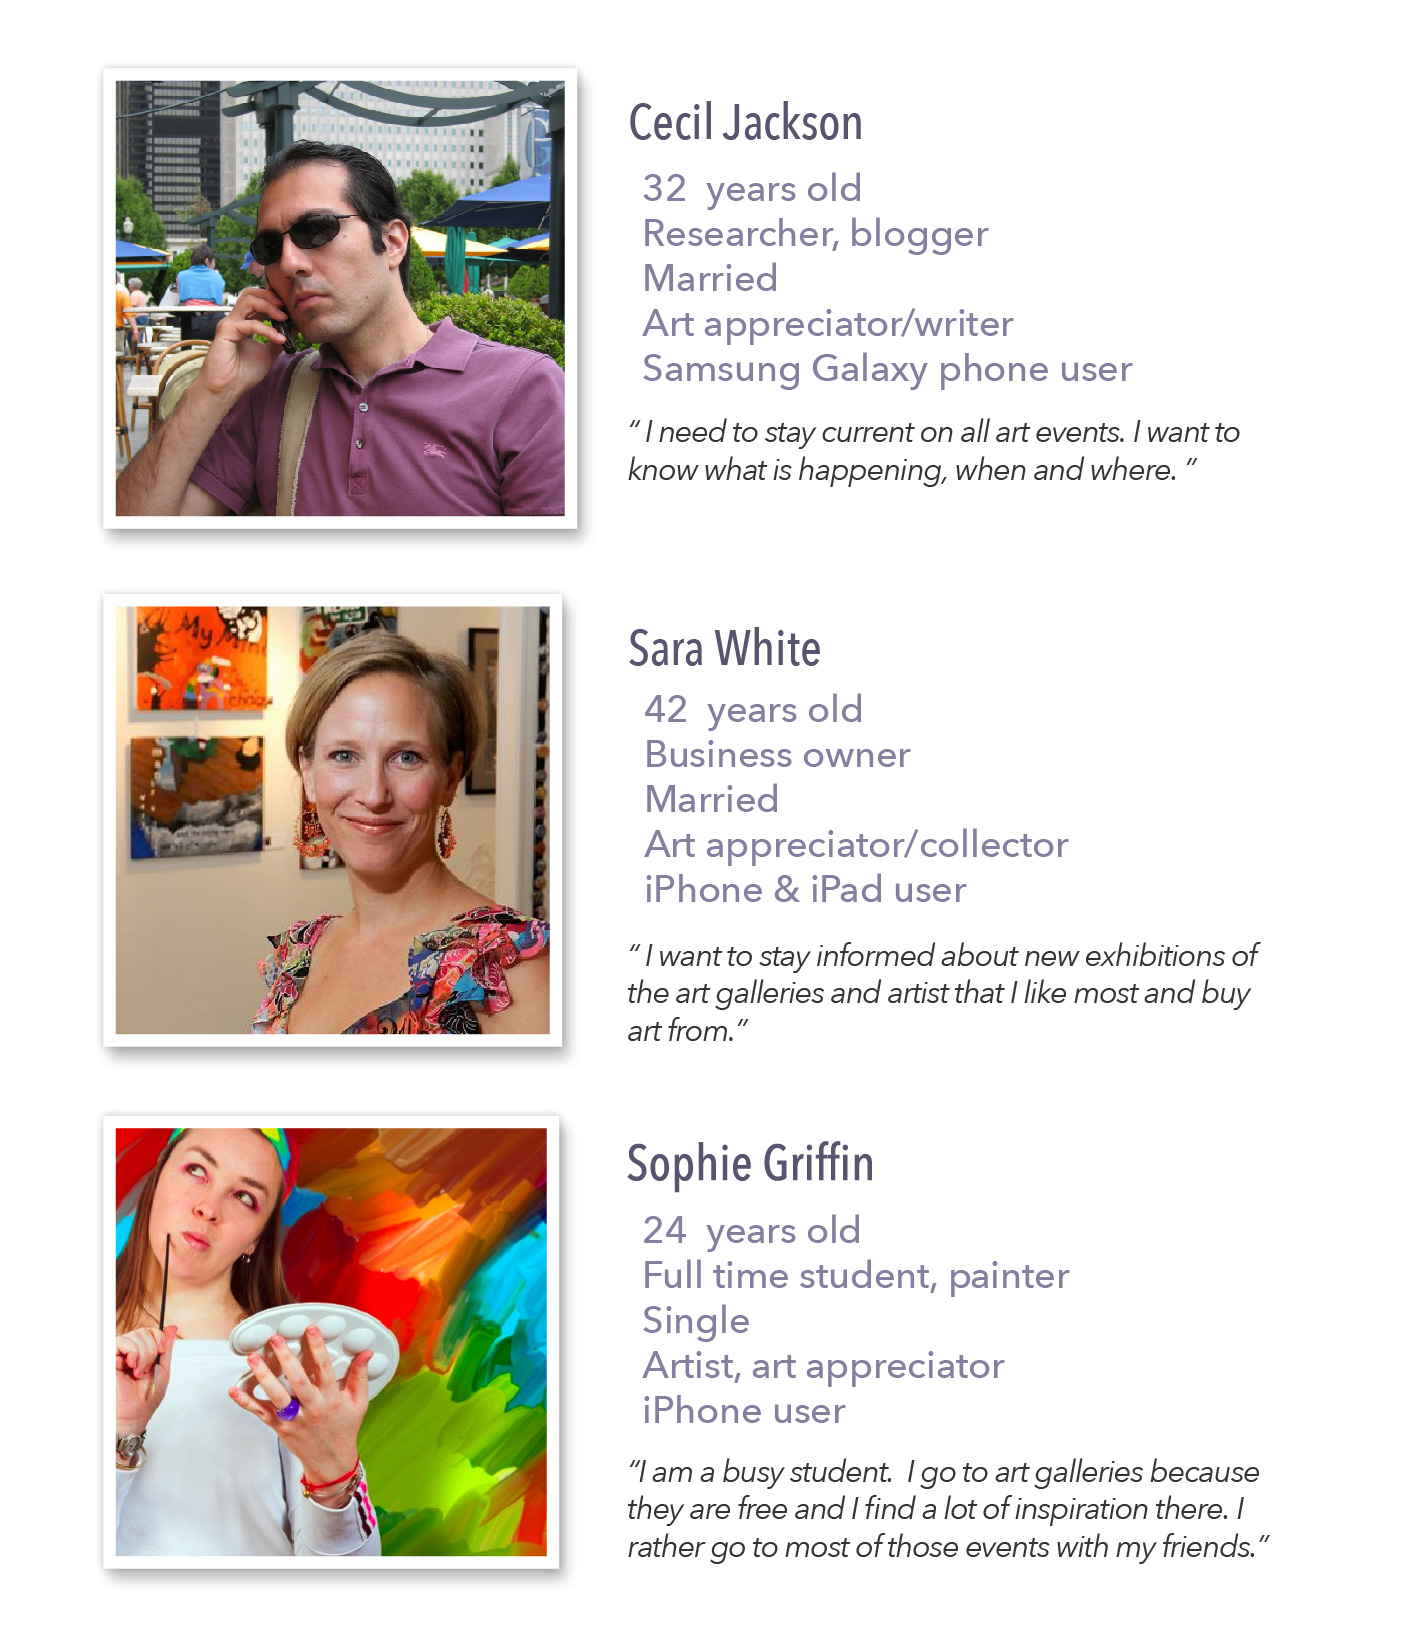
Target Audience and Persona
Primary target audience of Gallery Scene includes art collectors, dealers, buyers, educators, and gallery owners & personnel.
Secondary target audience are art appreciators, students, and frequent gallery visitors.
Flow Charts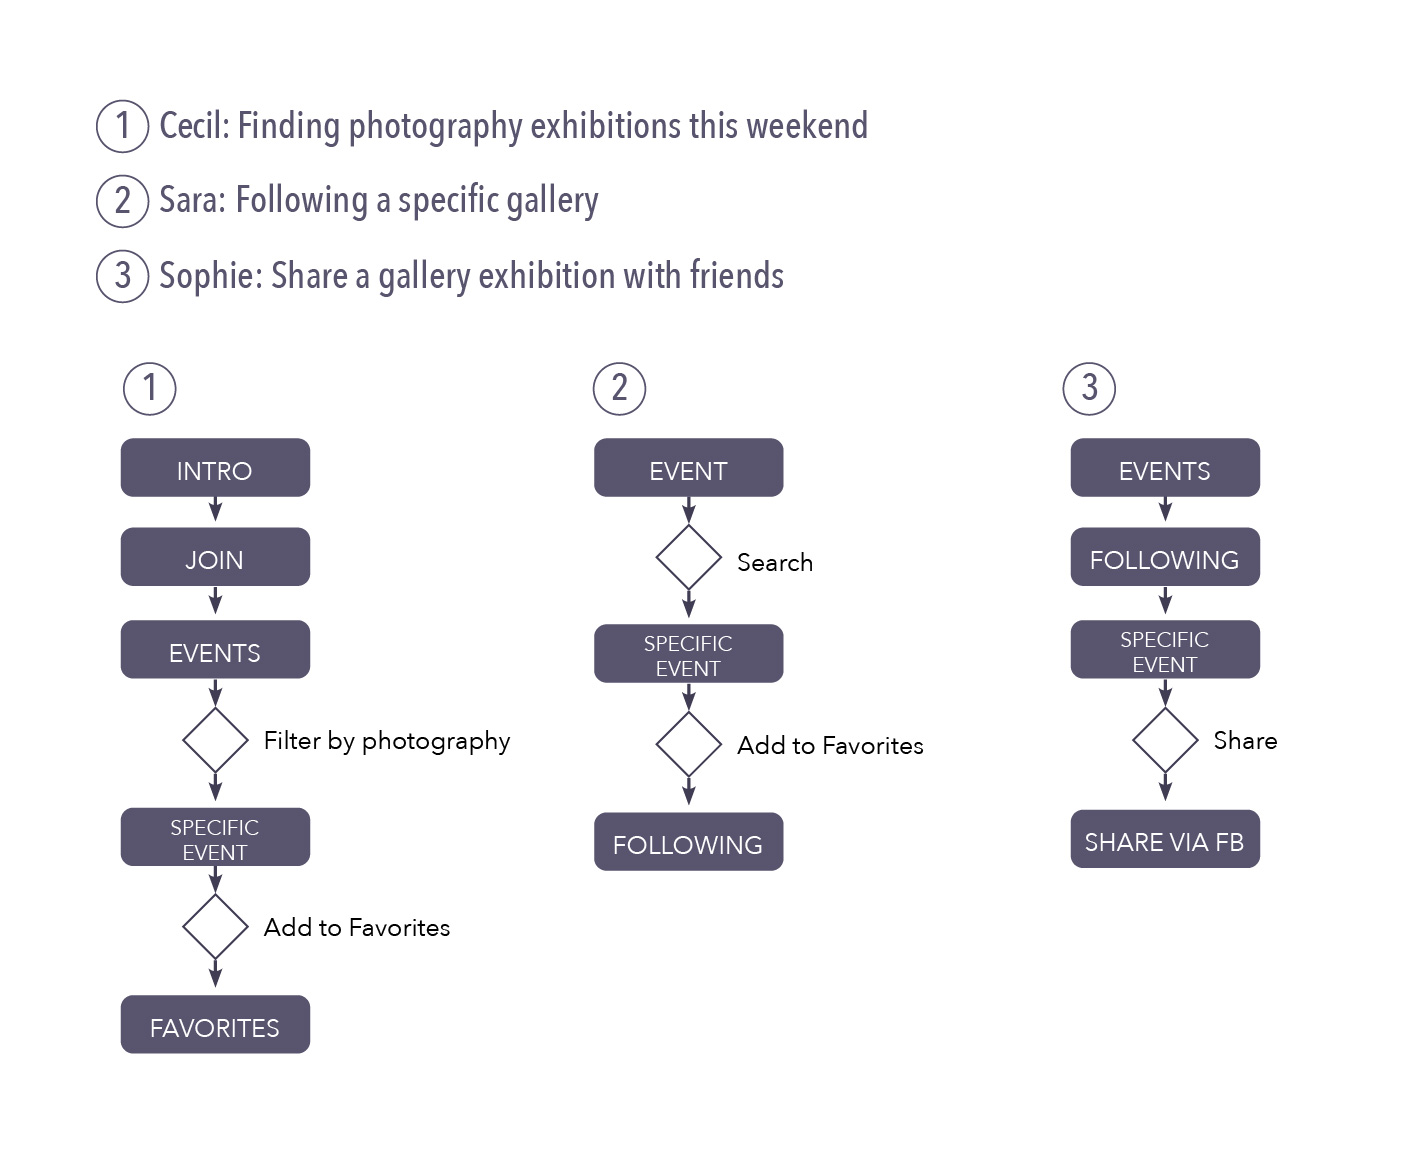
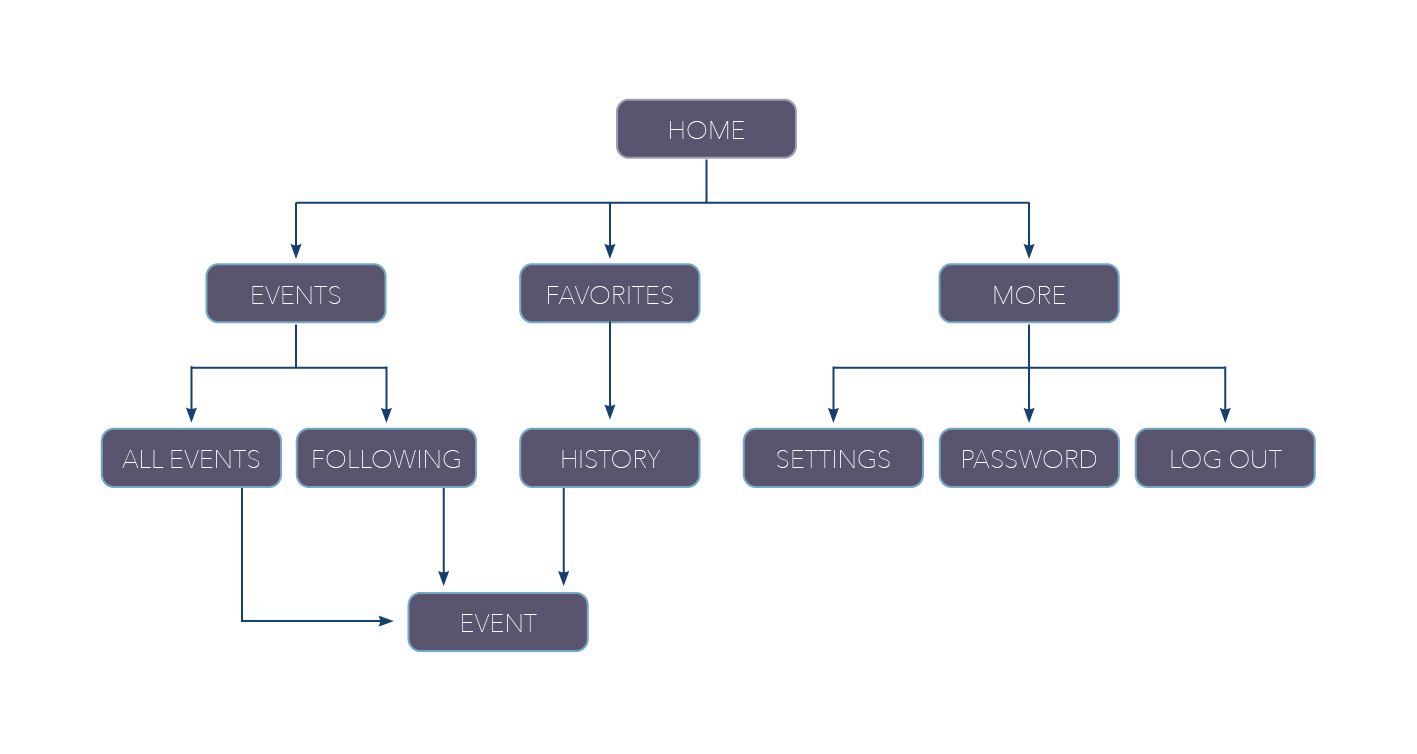
Site Map
Initial Sketches, Wireframes
At the beginning, my goal was to promote art galleries and Thursday art (SF art walk) to general art appreciators. At this stage, the focus was on receiving notifications and offering an interactive map for easy trip-planning to Thursday art.
Later on, I realized a limited number of galleries participate in Thursday & Saturday art walks and these events are mostly held within the same neighborhood, hence the trip-planning wasn’t an added value to my users.
I also recognized a more important need for professionals who would be more frequent and higher value users compared to ordinary art enthusiasts. This new finding led to change of focus for the project.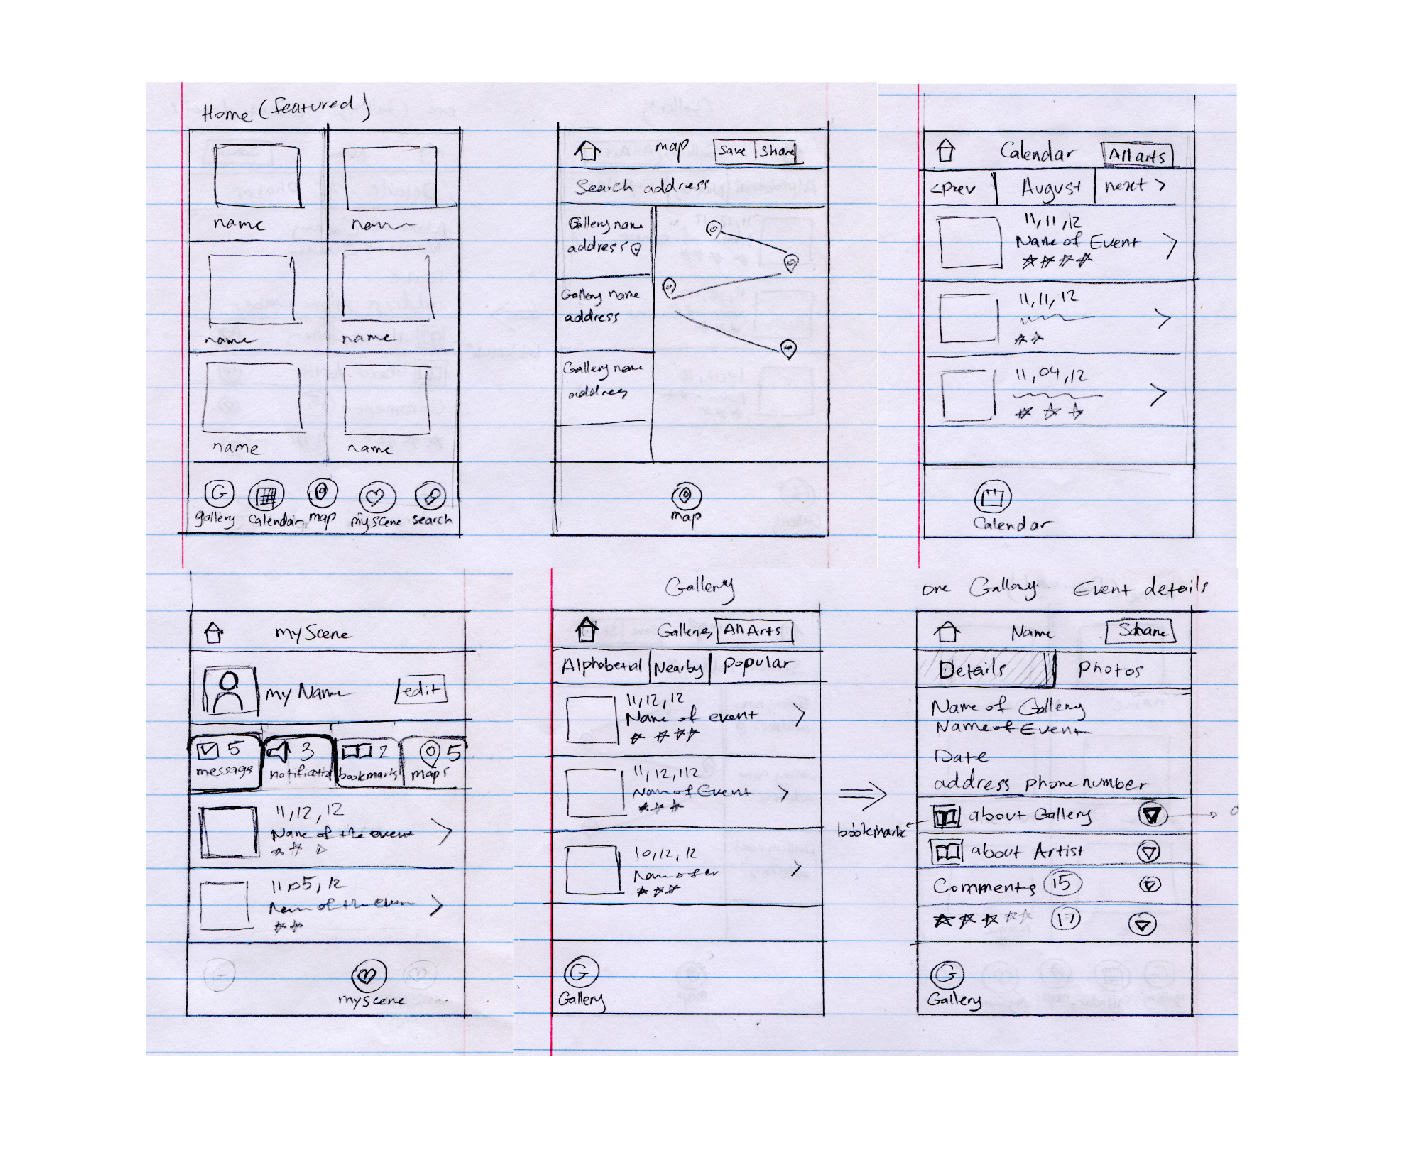
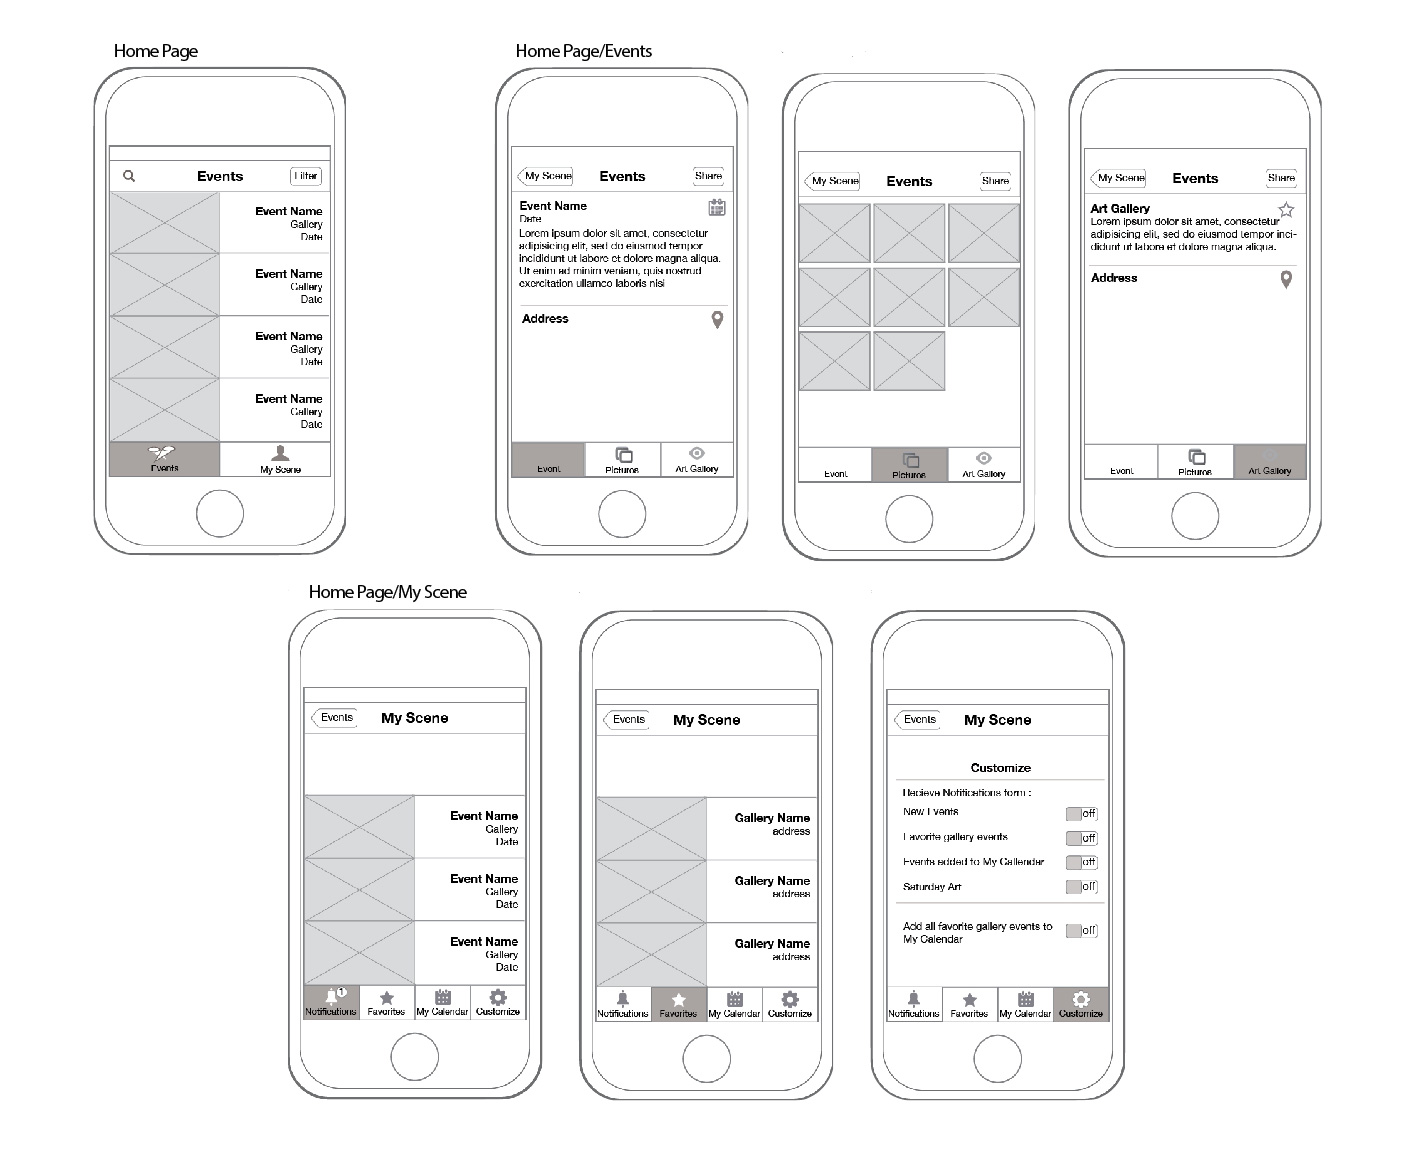
Second Design
On my second iteration, I simplified home page navigation into: 1) “Events”, that are today’s gallery events; and 2) “My Scene”, that is the user’s personal and favorites section. Through user research and prototype testing, I found out that my target audience is more interested in following their favorite art galleries and artists rather than receiving an overwhelming amount of notifications; this has led to the next design iteration.
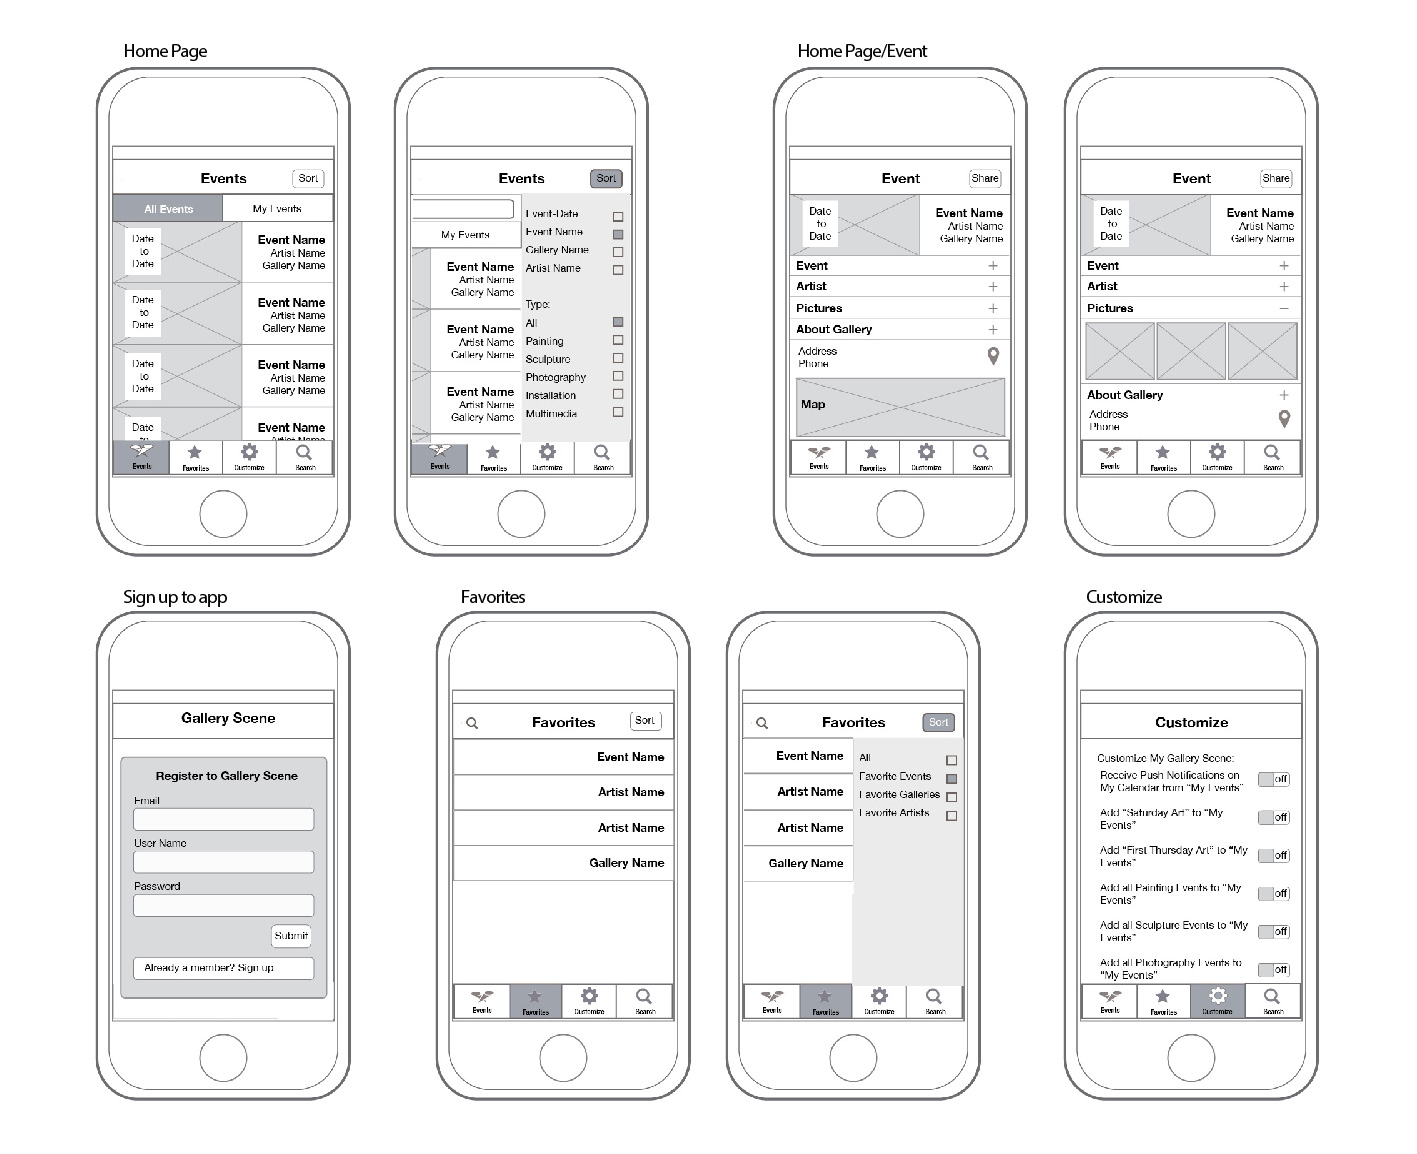
Third Design
On the third iteration, the primary goal is on the users’ seamless ability to add events, galleries, and artists to their “Favorites” and be able to “Follow” their favorites.
There was no major need for “user profile”; but instead, I added “My Events” tab on the main page where user can now follow their favorites.
Sorting and filtering functionality is also added to the events menu for further ease of use.
I also simplified the “Events” page and consolidated all details in one page using drop down panels.
Final Design
Based on test results from my users, I revised the final prototype design. Some of the more important revisions are:
– “Customize” button was in a very dominant position; instead I added it inside the “More” button including other utility links.
– A calendar to give the user option of choosing a date for their events.
– To eliminate confusion, added descriptive texts for first time users.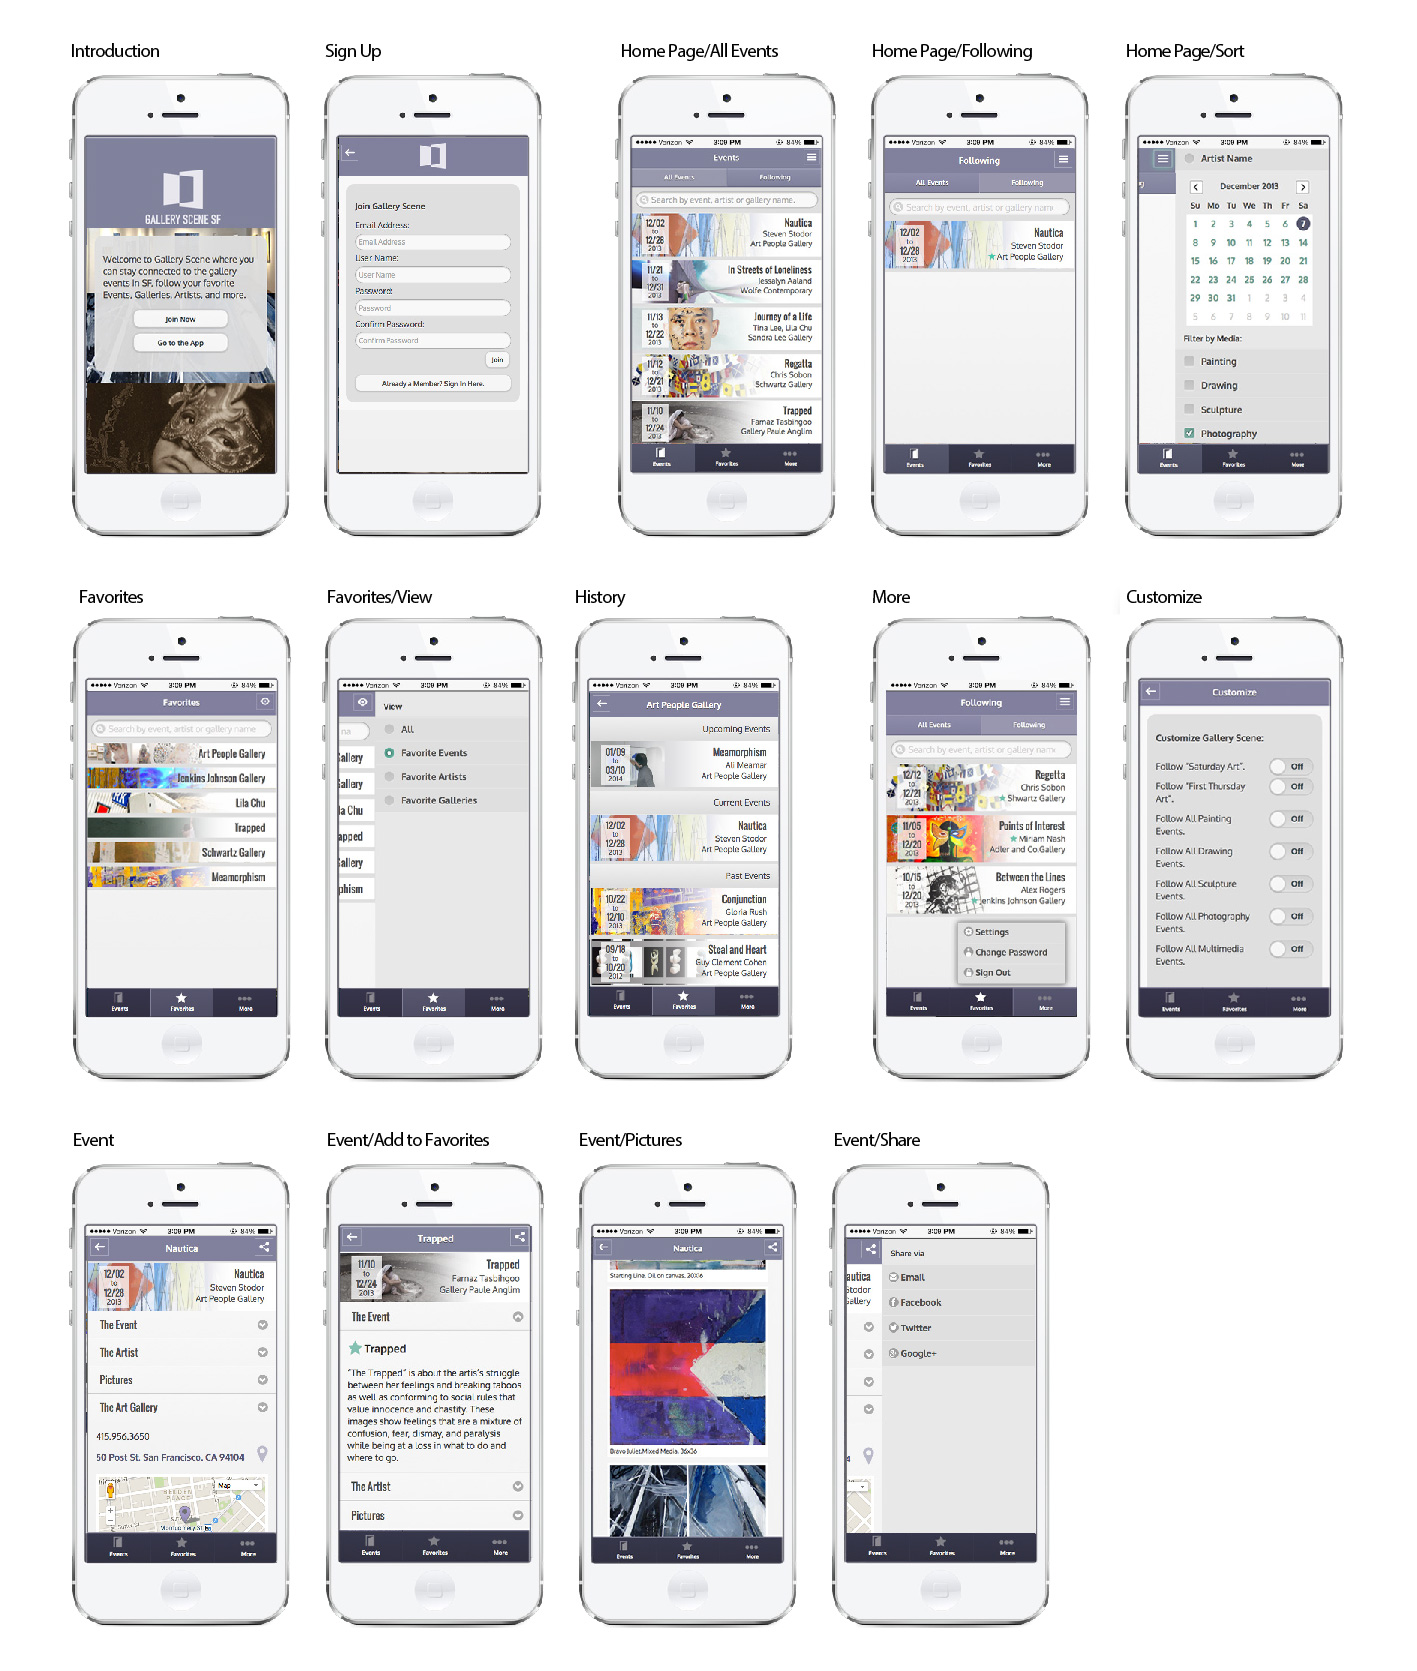
See it Working
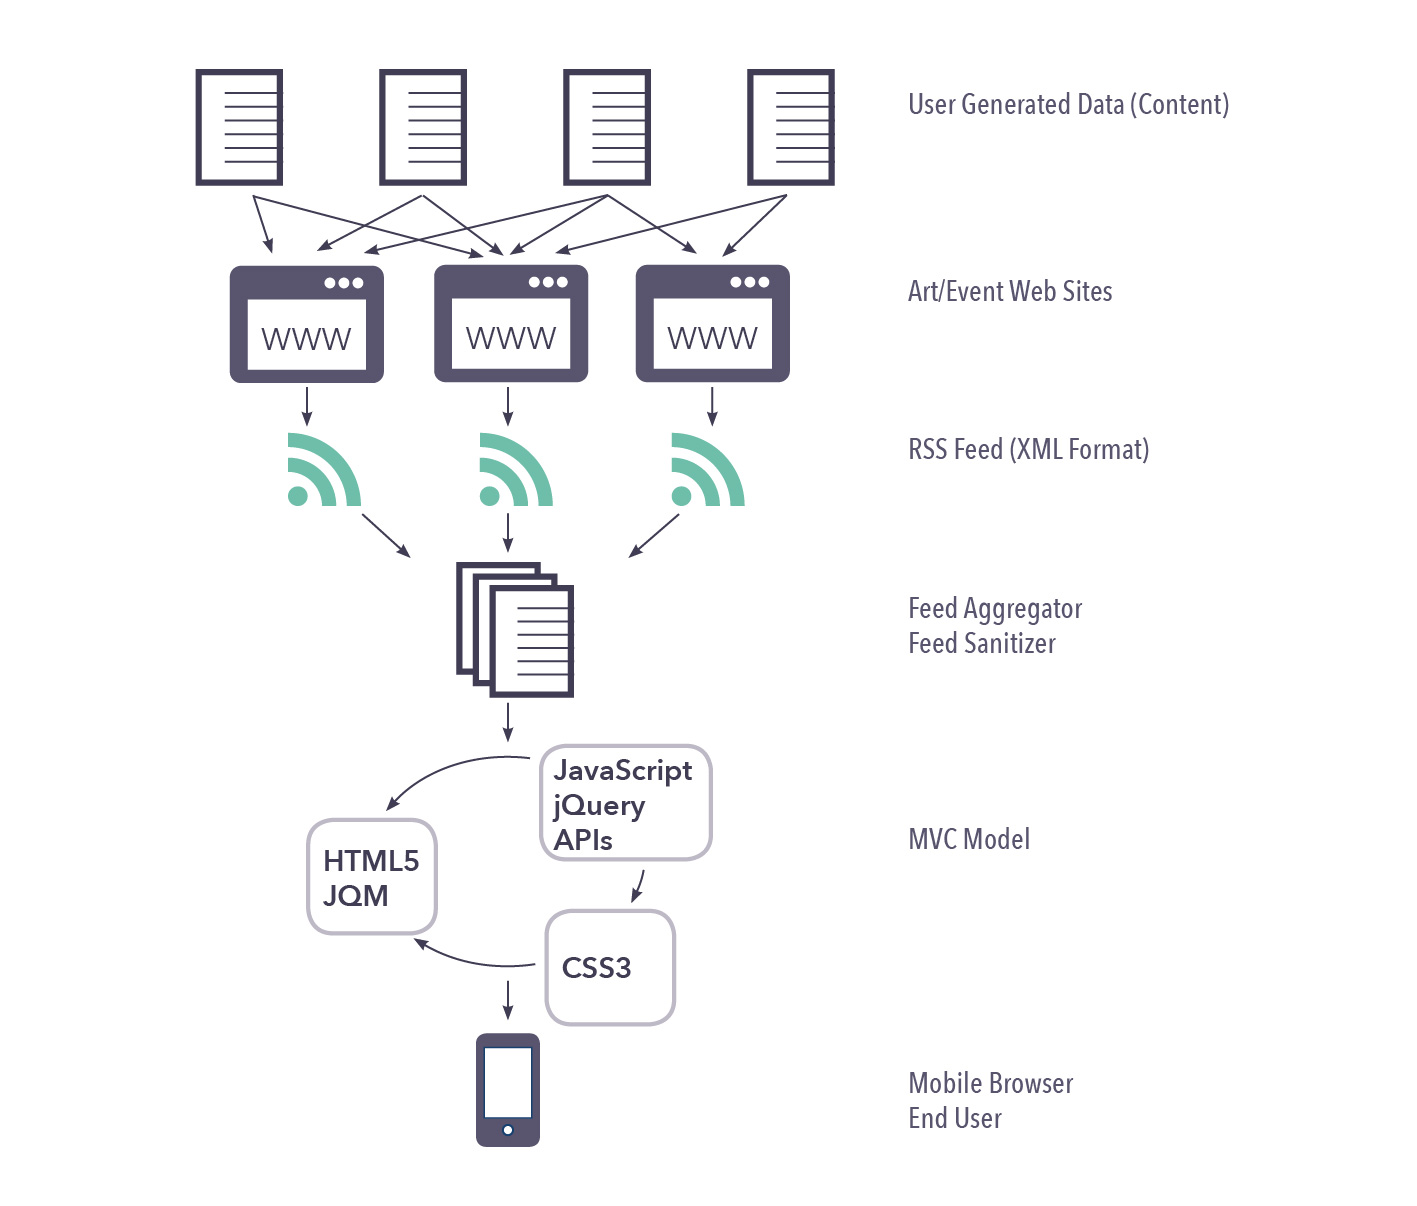
Data Flow Diagram
Promoting their new exhibitions, art galleries post information about the gallery and their events on various blogs or art related Websites. Most of these Websites publish this user generated data via RSS feed. Gallery Scene retrieves these RSS feeds to create the app’s content.